
Investors need more than a revenue forecast: they need to understand how a business earns, uses, and preserves cash. The clearest way to present financials to investors is to connect the income statement, balance sheet, and cash flow statement to realistic projections, explaining the assumptions behind each. Show cash movements from operating, investing, and financing activities, then relate the figures to the business’s priorities and funding needs.
An investor pitch deck is a concise presentation that explains the opportunity, the business model, its progress, and how investment could support its plans. Filling financial slides with every available figure can distract from the story. A focused explanation is easier to assess and discuss. This guide explains what each financial statement reveals about business health, how to make cash flow meaningful to investors, and how to organize a financial plan that links forecasts and key metrics to milestones, with the UAE business context in view.
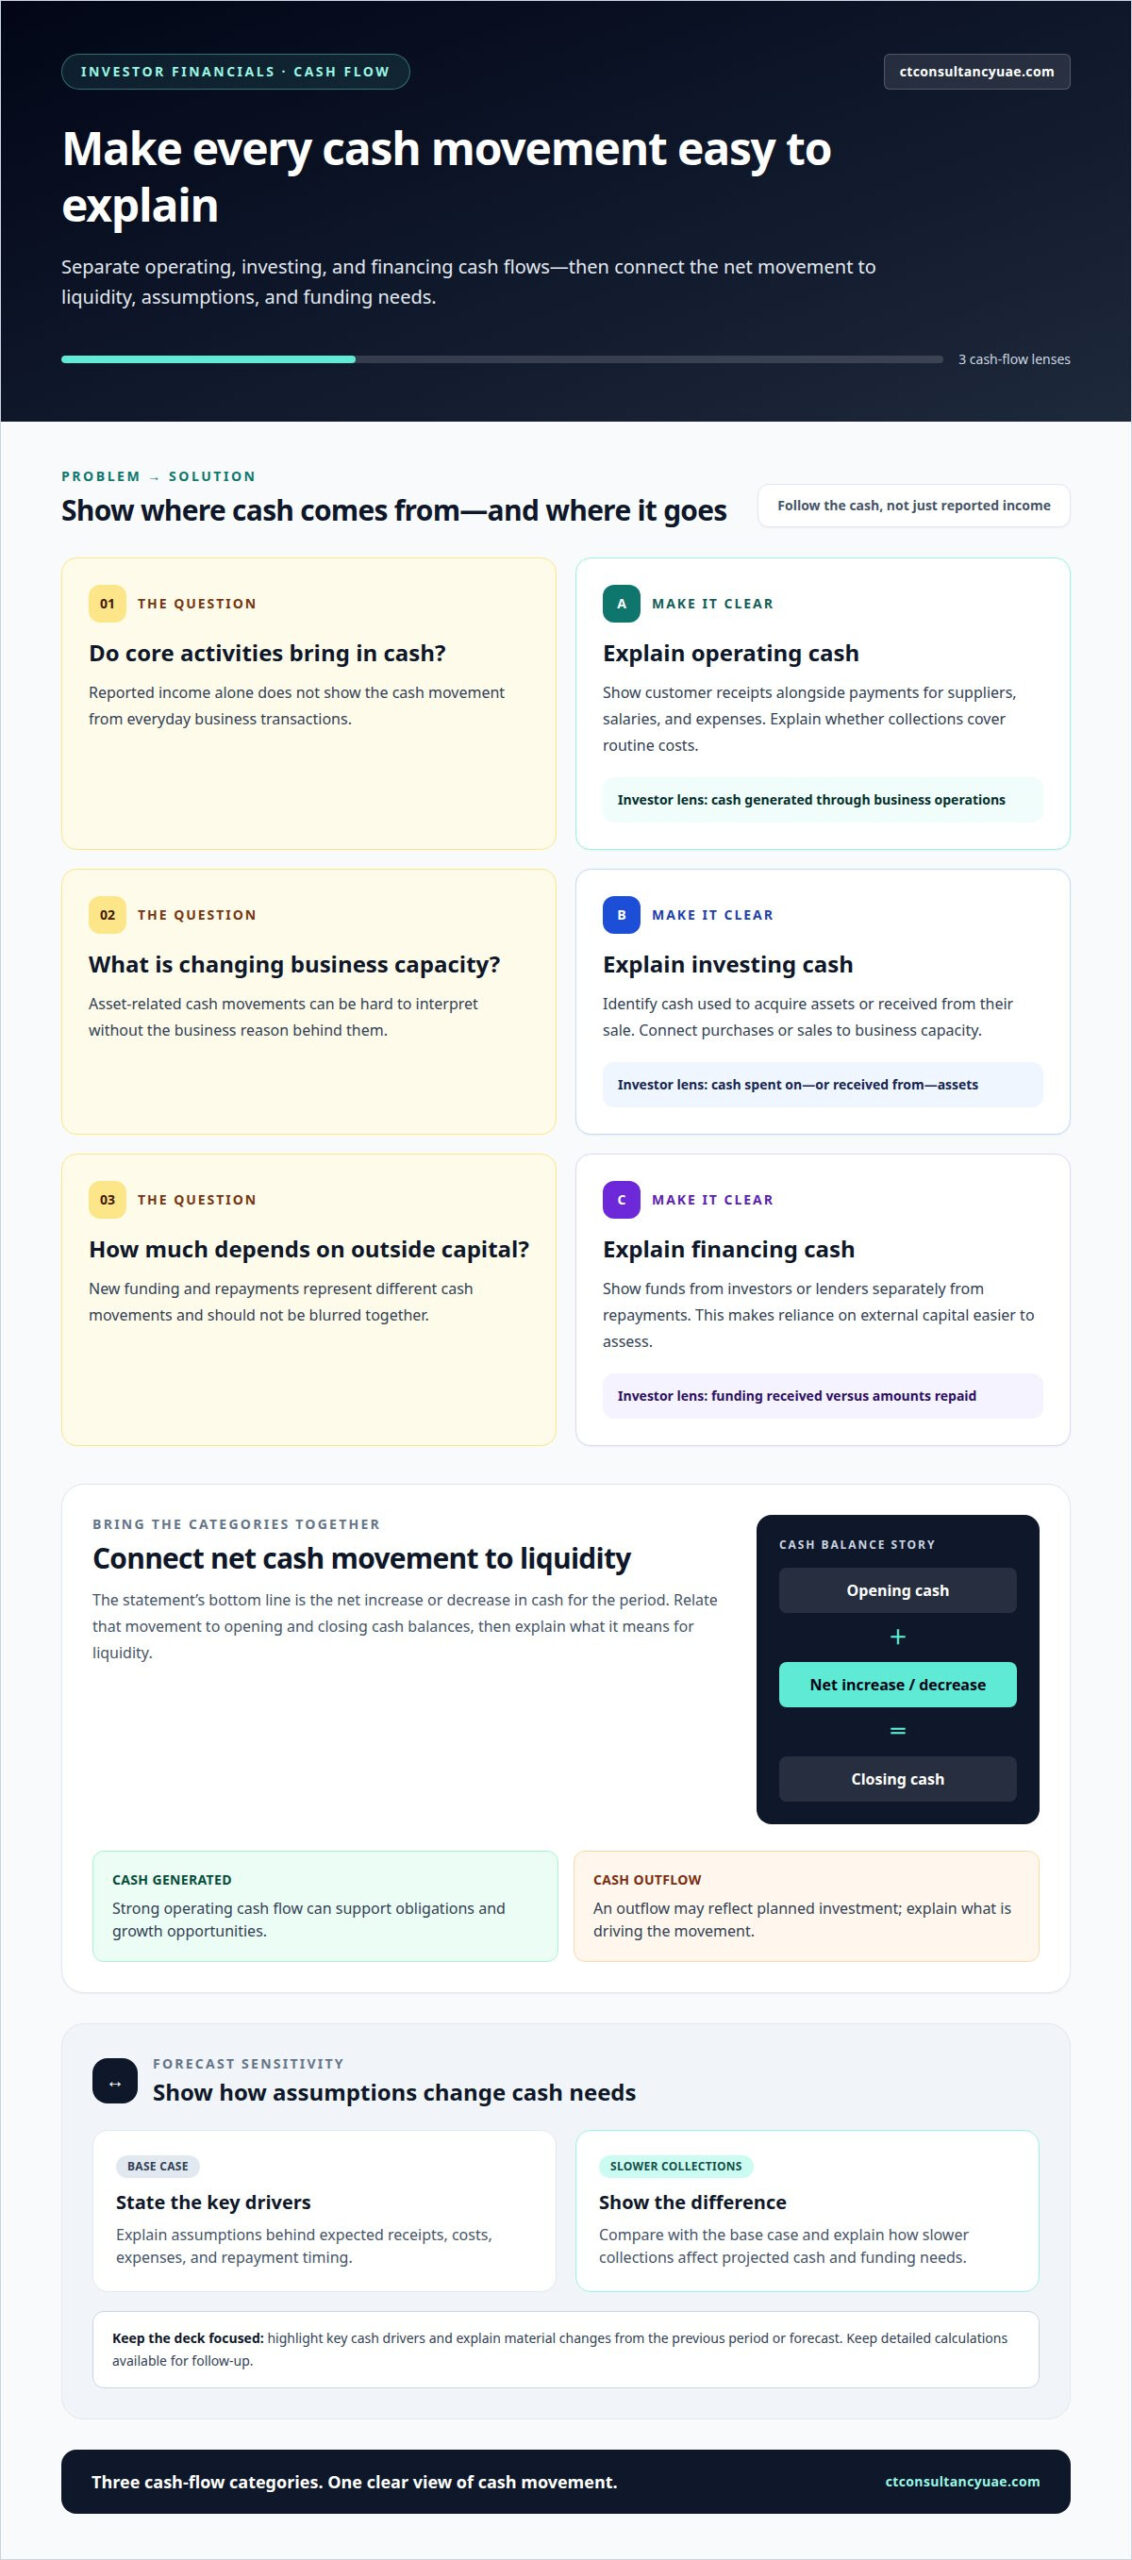
A cash flow statement tracks money moving between a company and the outside world over a period. It groups cash movements into operating, investing, and financing activities. Investors use these categories to distinguish cash generated through business operations from funds raised or spent elsewhere. For founders considering how to present financials to investors, this breakdown makes the movement from reported income to available cash easier to explain.
Operating activities reflect cash from core business transactions, including customer receipts and payments for suppliers, salaries, and expenses. Investing activities show cash used to acquire assets or received from their sale. Financing activities capture funds from investors or lenders, alongside repayments. Present the main drivers in each category, then explain material changes from the previous period or forecast.
The statement’s bottom line shows the net increase or decrease in cash for the period. Relate that movement to opening and closing cash balances, then explain what it means for liquidity. Strong operating cash flow can support obligations and growth opportunities, while an outflow may reflect planned investment. A direct cash flow statement can help explain expected cash movements and their effect on the bank balance.
When explaining assumptions and scenarios, identify the drivers behind expected receipts, costs, expenses, and repayment timing. Show how a change in a key assumption affects projected cash and funding needs. For example, compare a base case with a slower-collections scenario and explain what drives the difference. This gives investors a view of forecast sensitivity. A practical answer to how to present financials to investors also keeps detailed calculations available for follow-up, while the deck focuses on key cash drivers.
An indirect cash flow statement can form part of a three-statement financial model that separates operating, investing, and financing activities. This structure helps investors assess operating performance, investment decisions, and financing position together.
Investors assess financial statements together to understand performance, financial position, and growth potential. The income statement shows whether revenue growth is translating into profit or being absorbed by expenses.
An income statement reports revenue, expenses, gains, and losses over a period, such as a quarter or a year. It helps investors assess how the business earns income and whether its cost structure supports profitability. Explain movements in gross and net margins, connecting changes to pricing, sales mix, or operating expenses. Operating margin, calculated as income from operations divided by net revenue, can show how efficiently core activities generate profit.
Present historical performance as a consistent view of revenue, expenses, and profitability across comparable reporting periods. Start with the income statement, then highlight material changes and explain the operational factors behind them. Compare actual results with budgeted figures to show where performance matched expectations and where it diverged. This gives investors context for assessing the business’s trajectory, rather than leaving them to interpret disconnected numbers during a meeting.
A path to profitability explains how revenue growth, margins, and expense management could combine to produce stronger earnings. Show which business drivers must change, when those changes are expected, and how the forecast reflects them. Avoid presenting projected profit without explaining its assumptions. Investors may view rising revenue alongside weakening margins, or expenses growing faster than income, as warning signs. Unexplained results and footnotes about accounting practices, income taxes, pension plans, or stock options also merit attention because they can affect how financial statements are interpreted.
Use a concise narrative to connect past results with the proposed direction: identify the trend, explain its cause, and state its effect on profitability. Revenue growth indicates an ability to expand and generate income, but investors also assess whether that growth translates into stronger margins. EBITDA can serve as a proxy for operating profitability, while net income reflects the outcome after expenses, gains, and losses. Together, these measures help investors assess the company’s financial position and the credibility of its profitability plan.
A useful financial plan turns accounting records into a clear report of performance, position, and priorities. Understanding how to present financials to investors begins with connecting financial data to the business’s operations and plans.
A pitch-deck financial plan is a focused snapshot built around statements and metrics that explain the business. Include an income statement, balance sheet, and cash flow statement, then select key ratios and operating measures relevant to investor assessment. Pair actual results with budget comparisons where they clarify performance against expectations. Each slide should explain why its figures matter, rather than reproduce a full report.
Tailor financial data to the audience’s familiarity with accounting. Define specialist terms briefly, and use a chart or concise narrative when it makes a trend easier to understand. A supporting appendix can hold detailed schedules and calculations, leaving the main deck focused on financial position, equity, and operating outlook.
An investor financial model should show how key assumptions produce forecast results without requiring a presentation to walk through every cell. Present the big picture in the deck, including main revenue and cost drivers, and retain underlying schedules in an appendix. This lets investors follow the model’s logic and ask focused questions.
Use realistic projections and make assumptions visible, especially where changes affect expected income, expenses, or cash generation. A three-year projection can illustrate the business’s future position when its drivers and rationale are explained. Use reliable financial data, clear labels, and consistent links between statements so the model reads as one coherent view.
State the fundraising amount in AED and show how the proceeds are expected to advance specific business milestones. Connect each major use of funds to an operating outcome, such as expanding capacity, and explain the assumptions behind the timing. Investors can then assess how the request relates to the company’s priorities and financial plan.
Keep the presentation at decision level: show allocation, expected business impact, and milestones that indicate progress. Explain how the forecast changes as funds are deployed, with supporting calculations in the appendix. A clear approach to how to present financials to investors also makes cash-generation timing assumptions easy to follow and keeps the deck’s narrative, statements, and funding purpose aligned.
Investors use financial statements to examine performance, resources, obligations, and changes in ownership. Include the core statements in the deck or its appendix, then show how they relate to the business’s operating results and plans.
The balance sheet gives a snapshot of assets, liabilities, and shareholders’ equity at a specific point in time. Its underlying equation is assets equal liabilities plus shareholders’ equity. Investors can use this structure to assess the company’s resources and obligations, while subtracting liabilities from assets offers a rough estimate of net value if assets were sold and liabilities paid. Explain material movements, such as changes in debt or asset levels, rather than leaving the audience to infer their significance.
The income statement reports revenue, expenses, gains, and losses over a period, helping readers assess growth and profitability. Present it alongside the balance sheet so investors can consider reported results in the context of the company’s financial position. The cash flow statement adds a view of cash movements over time. Together, the statements provide complementary evidence, rather than three unrelated sets of figures.
A statement of shareholders’ equity can clarify changes in ownership interests over time. Include it when those changes help investors understand the company’s capital structure. Financial statement footnotes also deserve attention: they can explain accounting practices, income taxes, pension plans, and stock options. Highlight notes that materially affect interpretation and connect them to the relevant statement or metric.
Make reported figures easier to assess by showing actual results against budgeted figures. Explain notable differences with their business context, such as revenue falling short of expectations or expenses exceeding the plan. Keep slide summaries selective, and retain detailed statements and supporting schedules in the appendix. Financial statements are prepared using accounting rules such as IFRS, used by many international companies; consistency in the framework and presentation helps investors interpret the figures. For clear, connected reporting, explore professional accounting services to support your financial statements.
CTC Tax & Accounting helps businesses prepare clearer financial information for investor discussions through Bookkeeping and Accounting Services and Internal Audit Services. When records need structure or financial processes require review, these services can support consistent reporting and help identify issues that affect how results are interpreted.
For businesses operating in the UAE, VAT Registration and Compliance and Corporate Tax Advisory can help address tax matters relevant to financial planning and reporting. The right support depends on the business’s records, reporting needs, and stage of growth. CTC Tax & Accounting can align this work with the questions founders need to answer for investors.
Contact CTC Tax & Accounting for a free consultation about preparing your financial information.
Your next step is to ensure the financial narrative remains consistent beyond the pitch deck. Investors may ask how assumptions connect to recorded results, how the business monitors financial performance, and what supports its forecasts. A clear response depends on reliable underlying records and explanations that reflect the company’s actual position. Preparing for those discussions can also reveal where reporting processes need refinement.
CTC Tax & Accounting offers Bookkeeping and Accounting Services, Internal Audit Services, and VAT Registration and Compliance to support businesses preparing financial information and strengthening reporting processes. The right support can help connect accounting records and compliance considerations with a coherent investor-facing picture. For tailored assistance as you prepare your financial story, contact CTC Tax & Accounting.
With a well-supported financial narrative, you can enter investor discussions prepared to explain the figures and the decisions behind them.
An investor pitch deck is a concise presentation that helps an investor assess a business opportunity and decide whether to explore funding further. Organize its story around the customer problem, proposed solution, evidence of demand, business model, team, and funding purpose. Financial slides support that narrative rather than replace it. Tailor the emphasis to the investor’s experience and the company’s stage.
Build projections from operating drivers rather than applying an unexplained growth rate. Estimate sales from customer volumes and pricing, then connect direct costs, staffing, overhead, and planned investment. Keep assumptions visible and consistent across income, cash, and balance sheet forecasts. Compare a base case with a slower sales or collections case, and describe the decisions that would address resulting funding pressure. This shows how projections respond to changing conditions.
Select KPIs that explain customer economics, cost structure, and financial resilience, rather than displaying every available measure. Customer acquisition cost (CAC) and customer lifetime value (LTV) help frame acquisition efficiency and expected customer value; cost of goods sold clarifies direct delivery costs. Pair these with revenue growth and cash burn only when they address the investor’s decision, and define each metric’s calculation and reporting period.
Explain revenue growth by identifying its driver, such as more customers, higher purchase frequency, or changed pricing, then distinguish growth from improved profitability. Describe margins alongside the costs that influence them. For cash burn, state how quickly reserves are being used; explain runway as the time those reserves can support current operations. Show how slower collections or higher spending change the outlook, and identify the assumptions behind that scenario.
UAE startups should present figures in a consistent currency and accounting framework, while explaining how local tax matters are reflected in reported results. Use AED for monetary figures, align reporting periods across statements, and distinguish tax balances from operating expenses where relevant. Identify the accounting basis used, such as IFRS where applicable, and include concise notes on material assumptions so investors can interpret comparisons against the underlying business records.